The Status Quo
Built for construction and industrial sales teams.
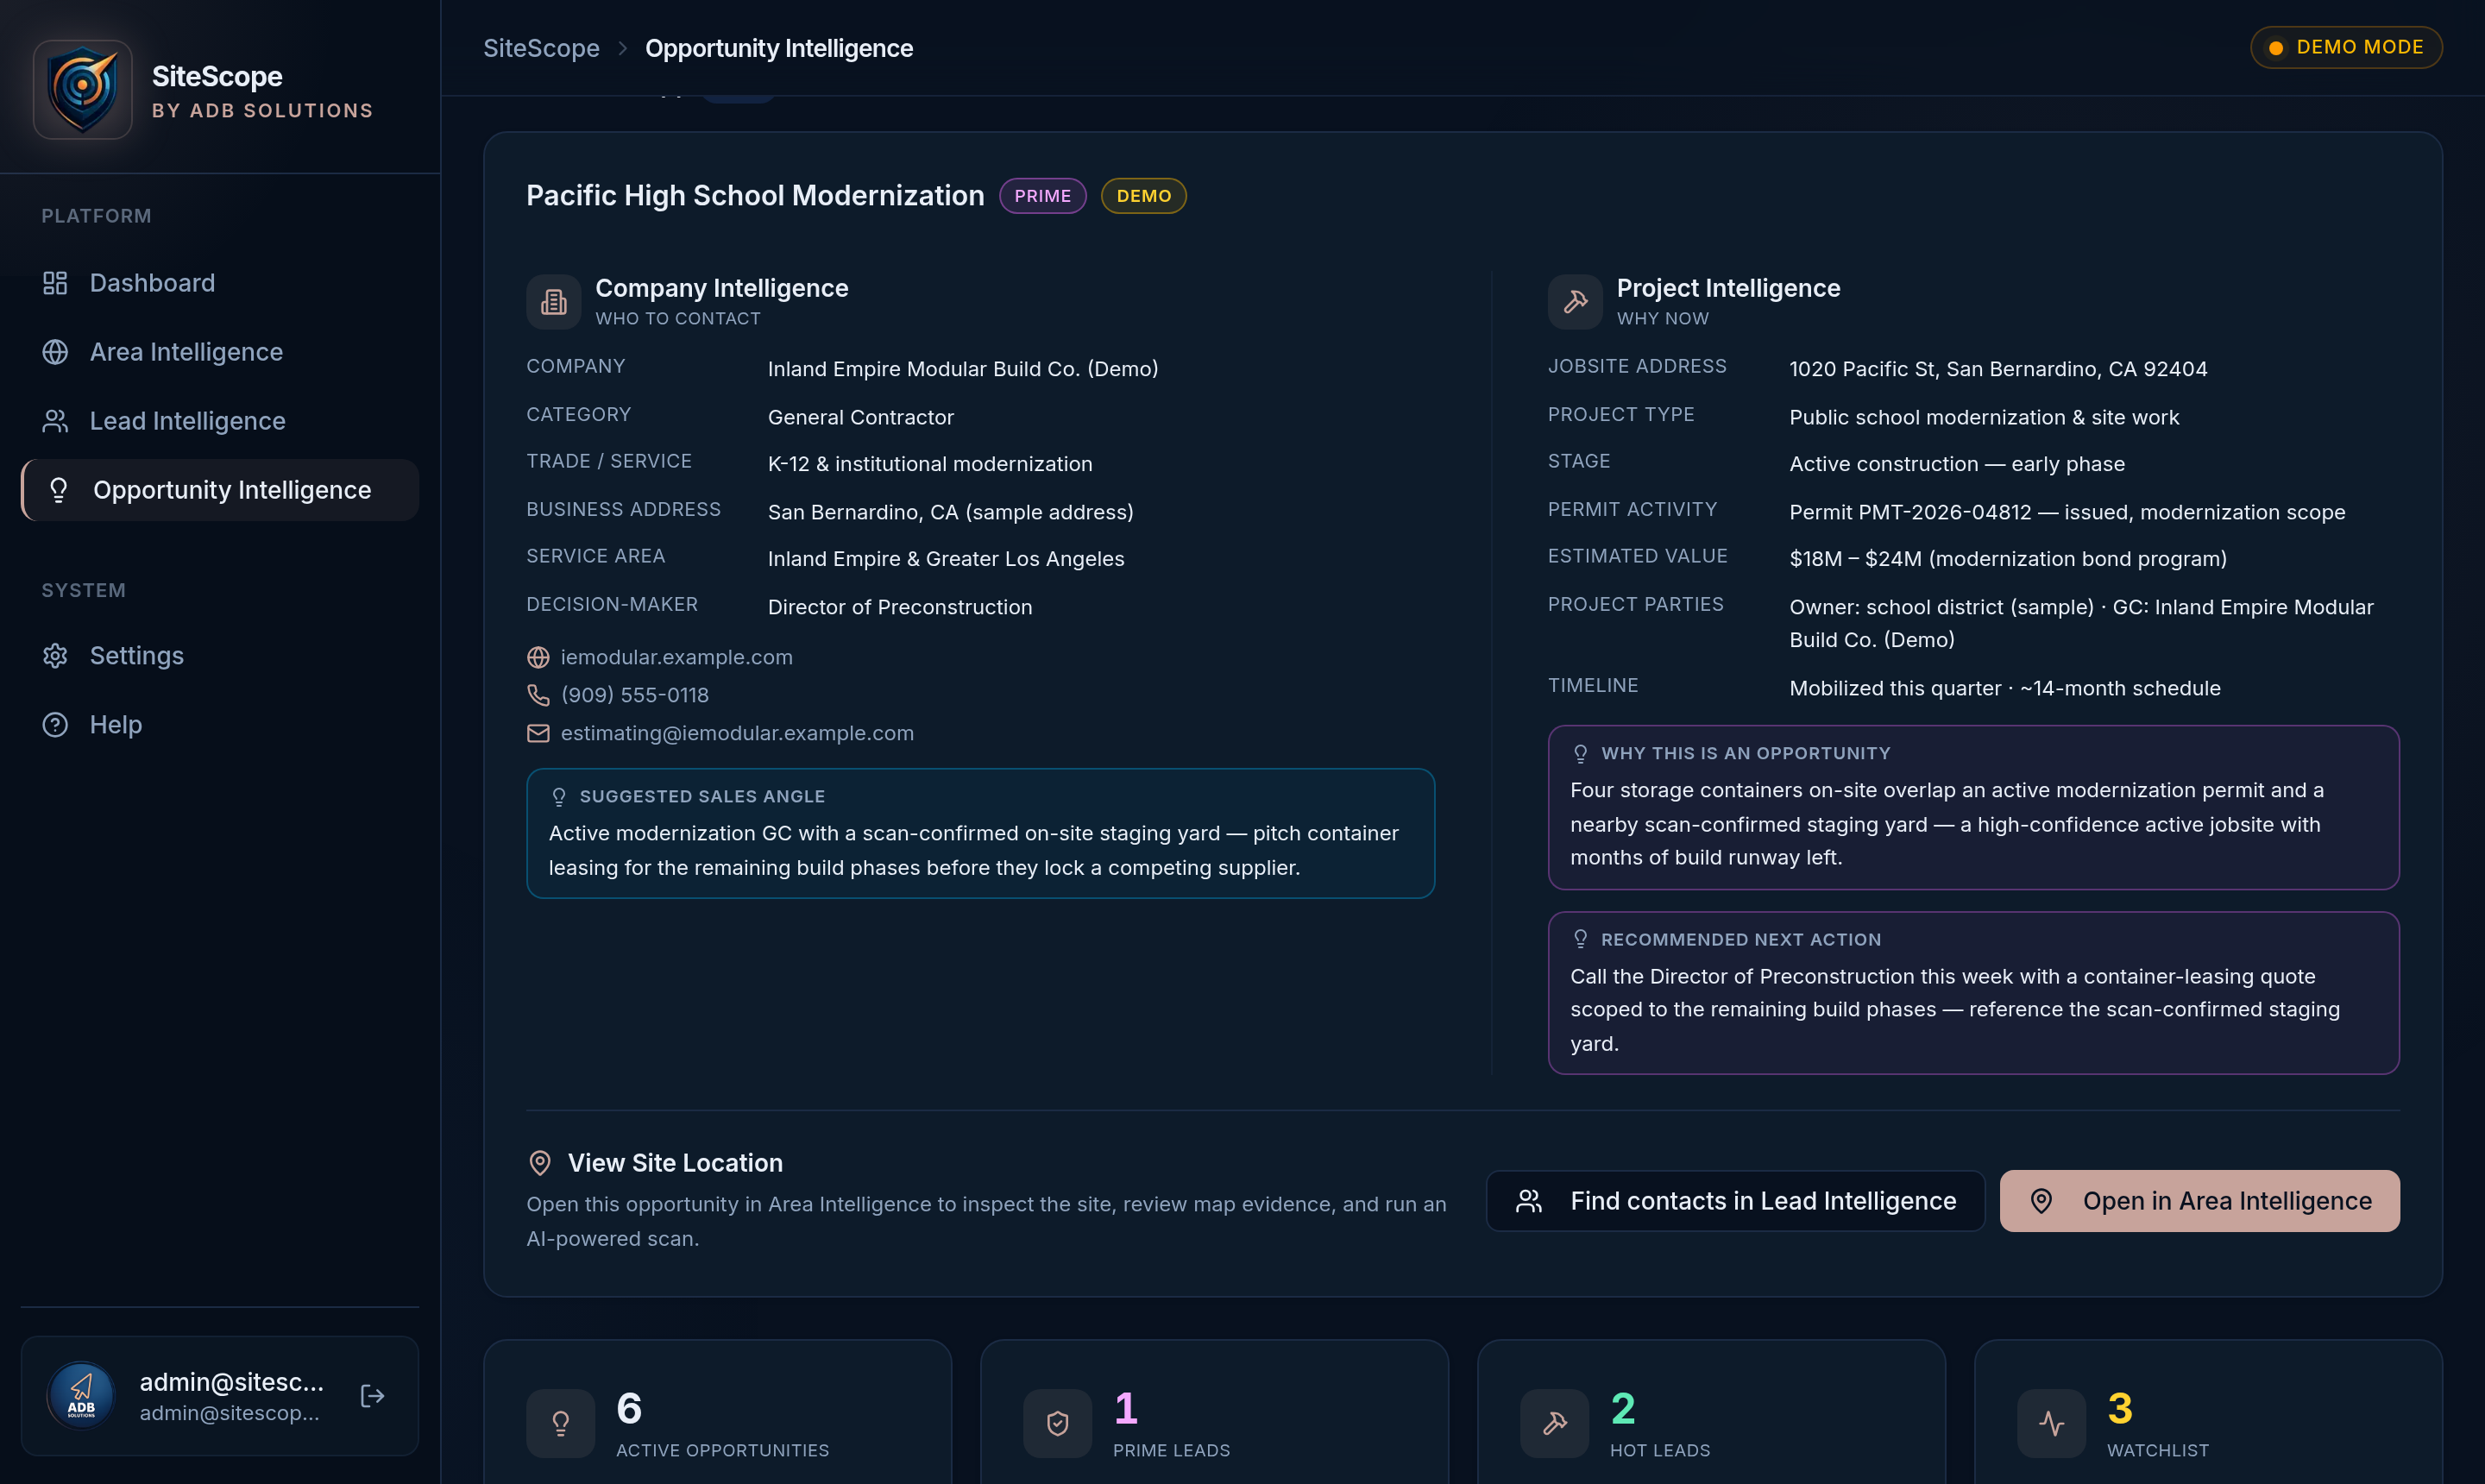
Construction opportunity data is scattered across permit portals, bid boards, maps, company websites, public records, and directories. SiteScope is being built to organize those signals into a clearer sales workflow — where activity may be happening, which companies may be involved, and who may be worth contacting.
Without SiteScope
-
Opportunity data scattered everywhere.Permits, bid boards, maps, public records, and directories rarely live in one place.
-
Weeks of windshield time and manual research.Reps drive routes and dig through portals before they can build a single lead list.
-
No practical way to research a territory.A region might have 10,000 prospects. You can’t look at all of them — so you don’t.

With SiteScope
-
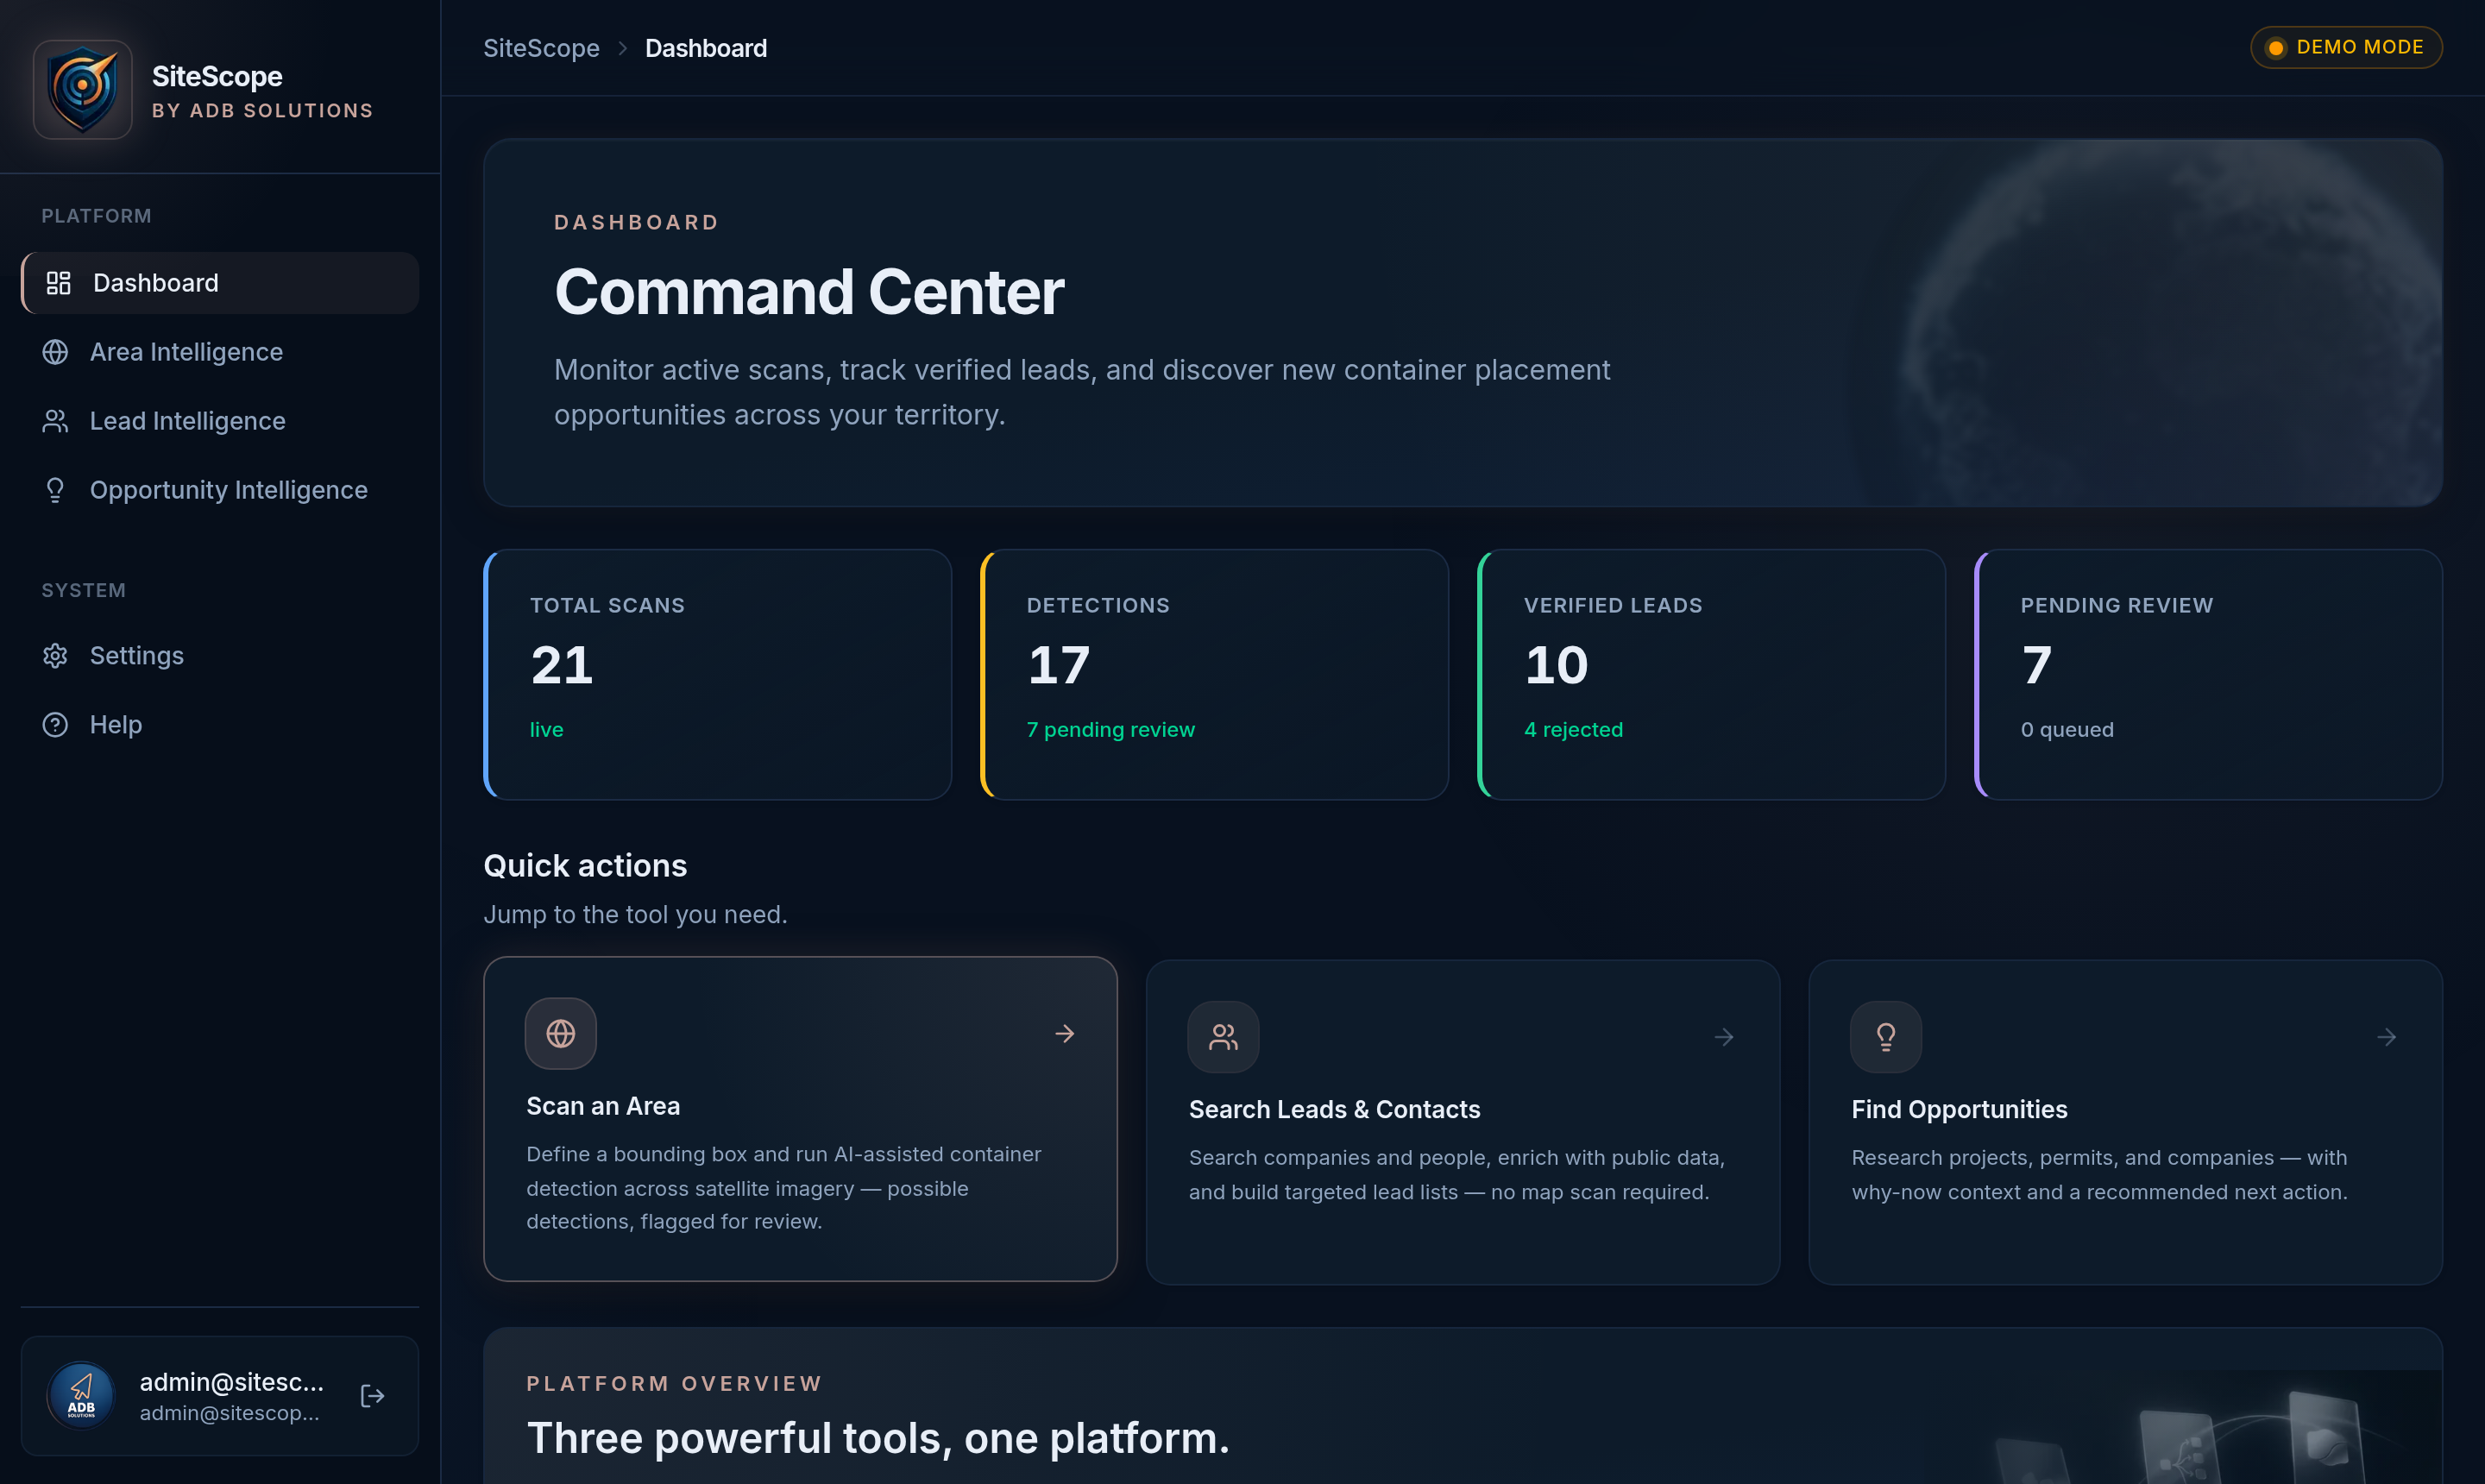
Public project signals in one view.Permits, bids, and jobsite activity signals organized into a clearer sales workflow.
-
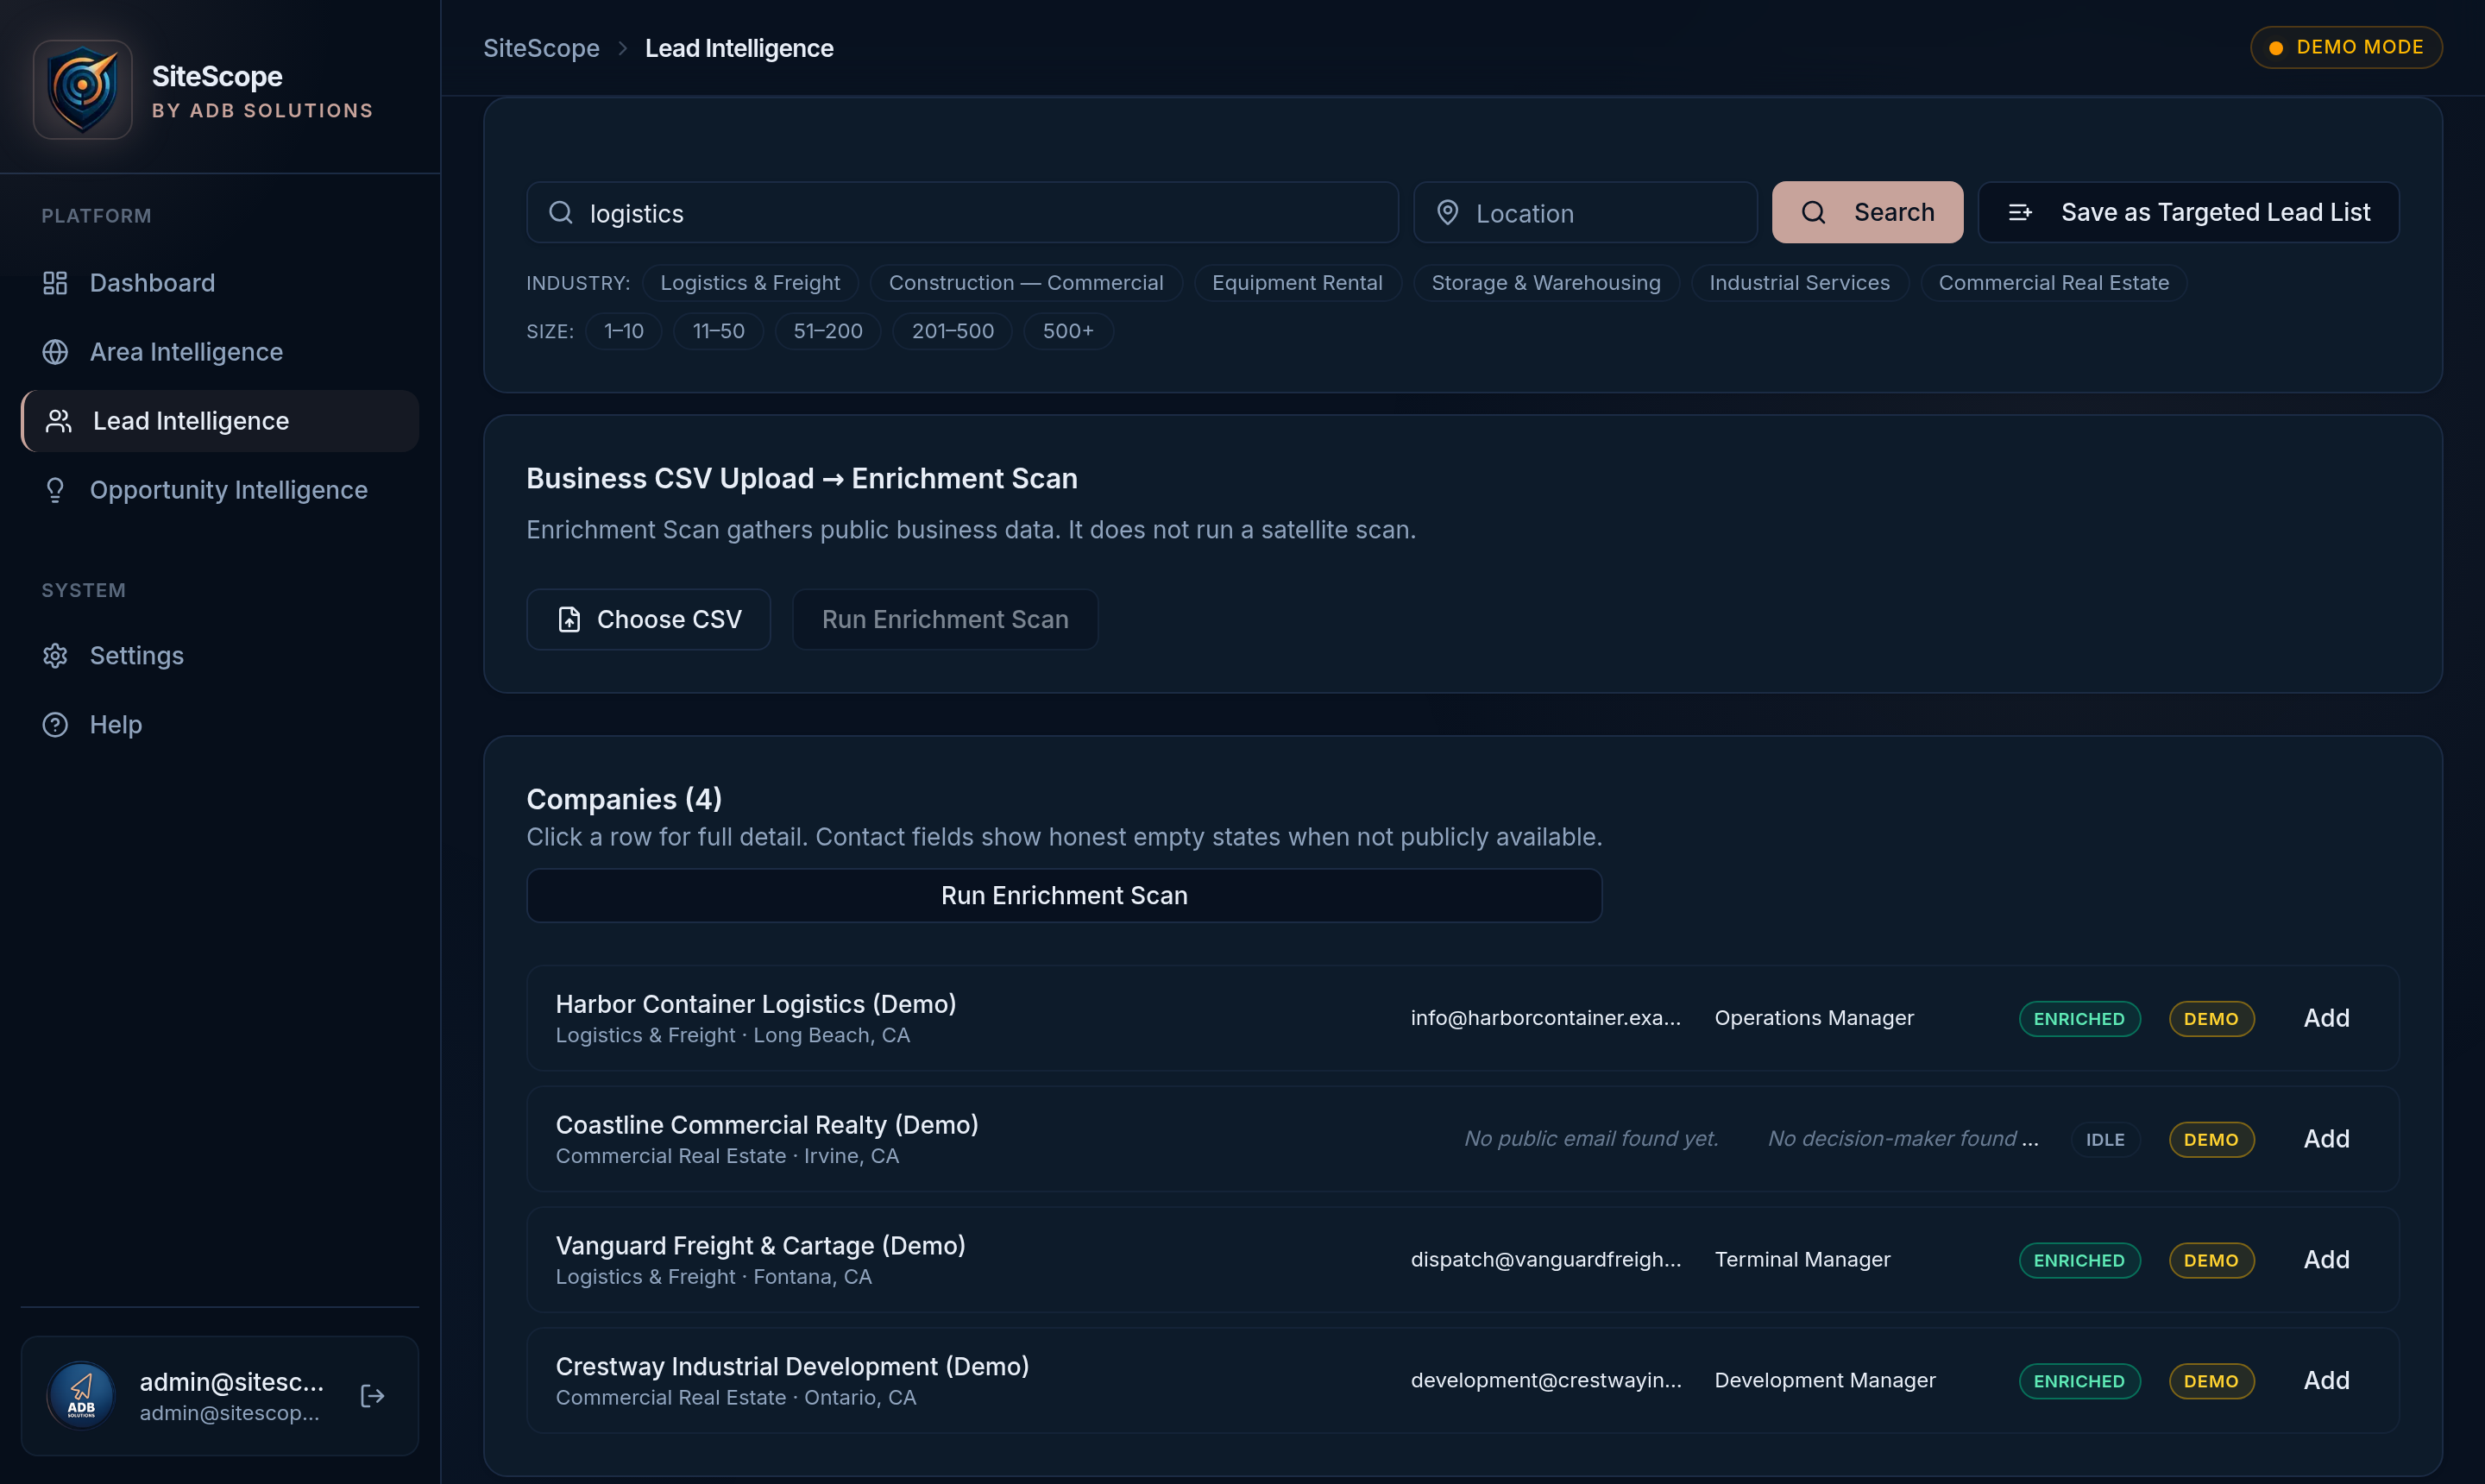
Company information and contact discovery.Public company data, contacts, and decision-makers attached to each possible opportunity.
-
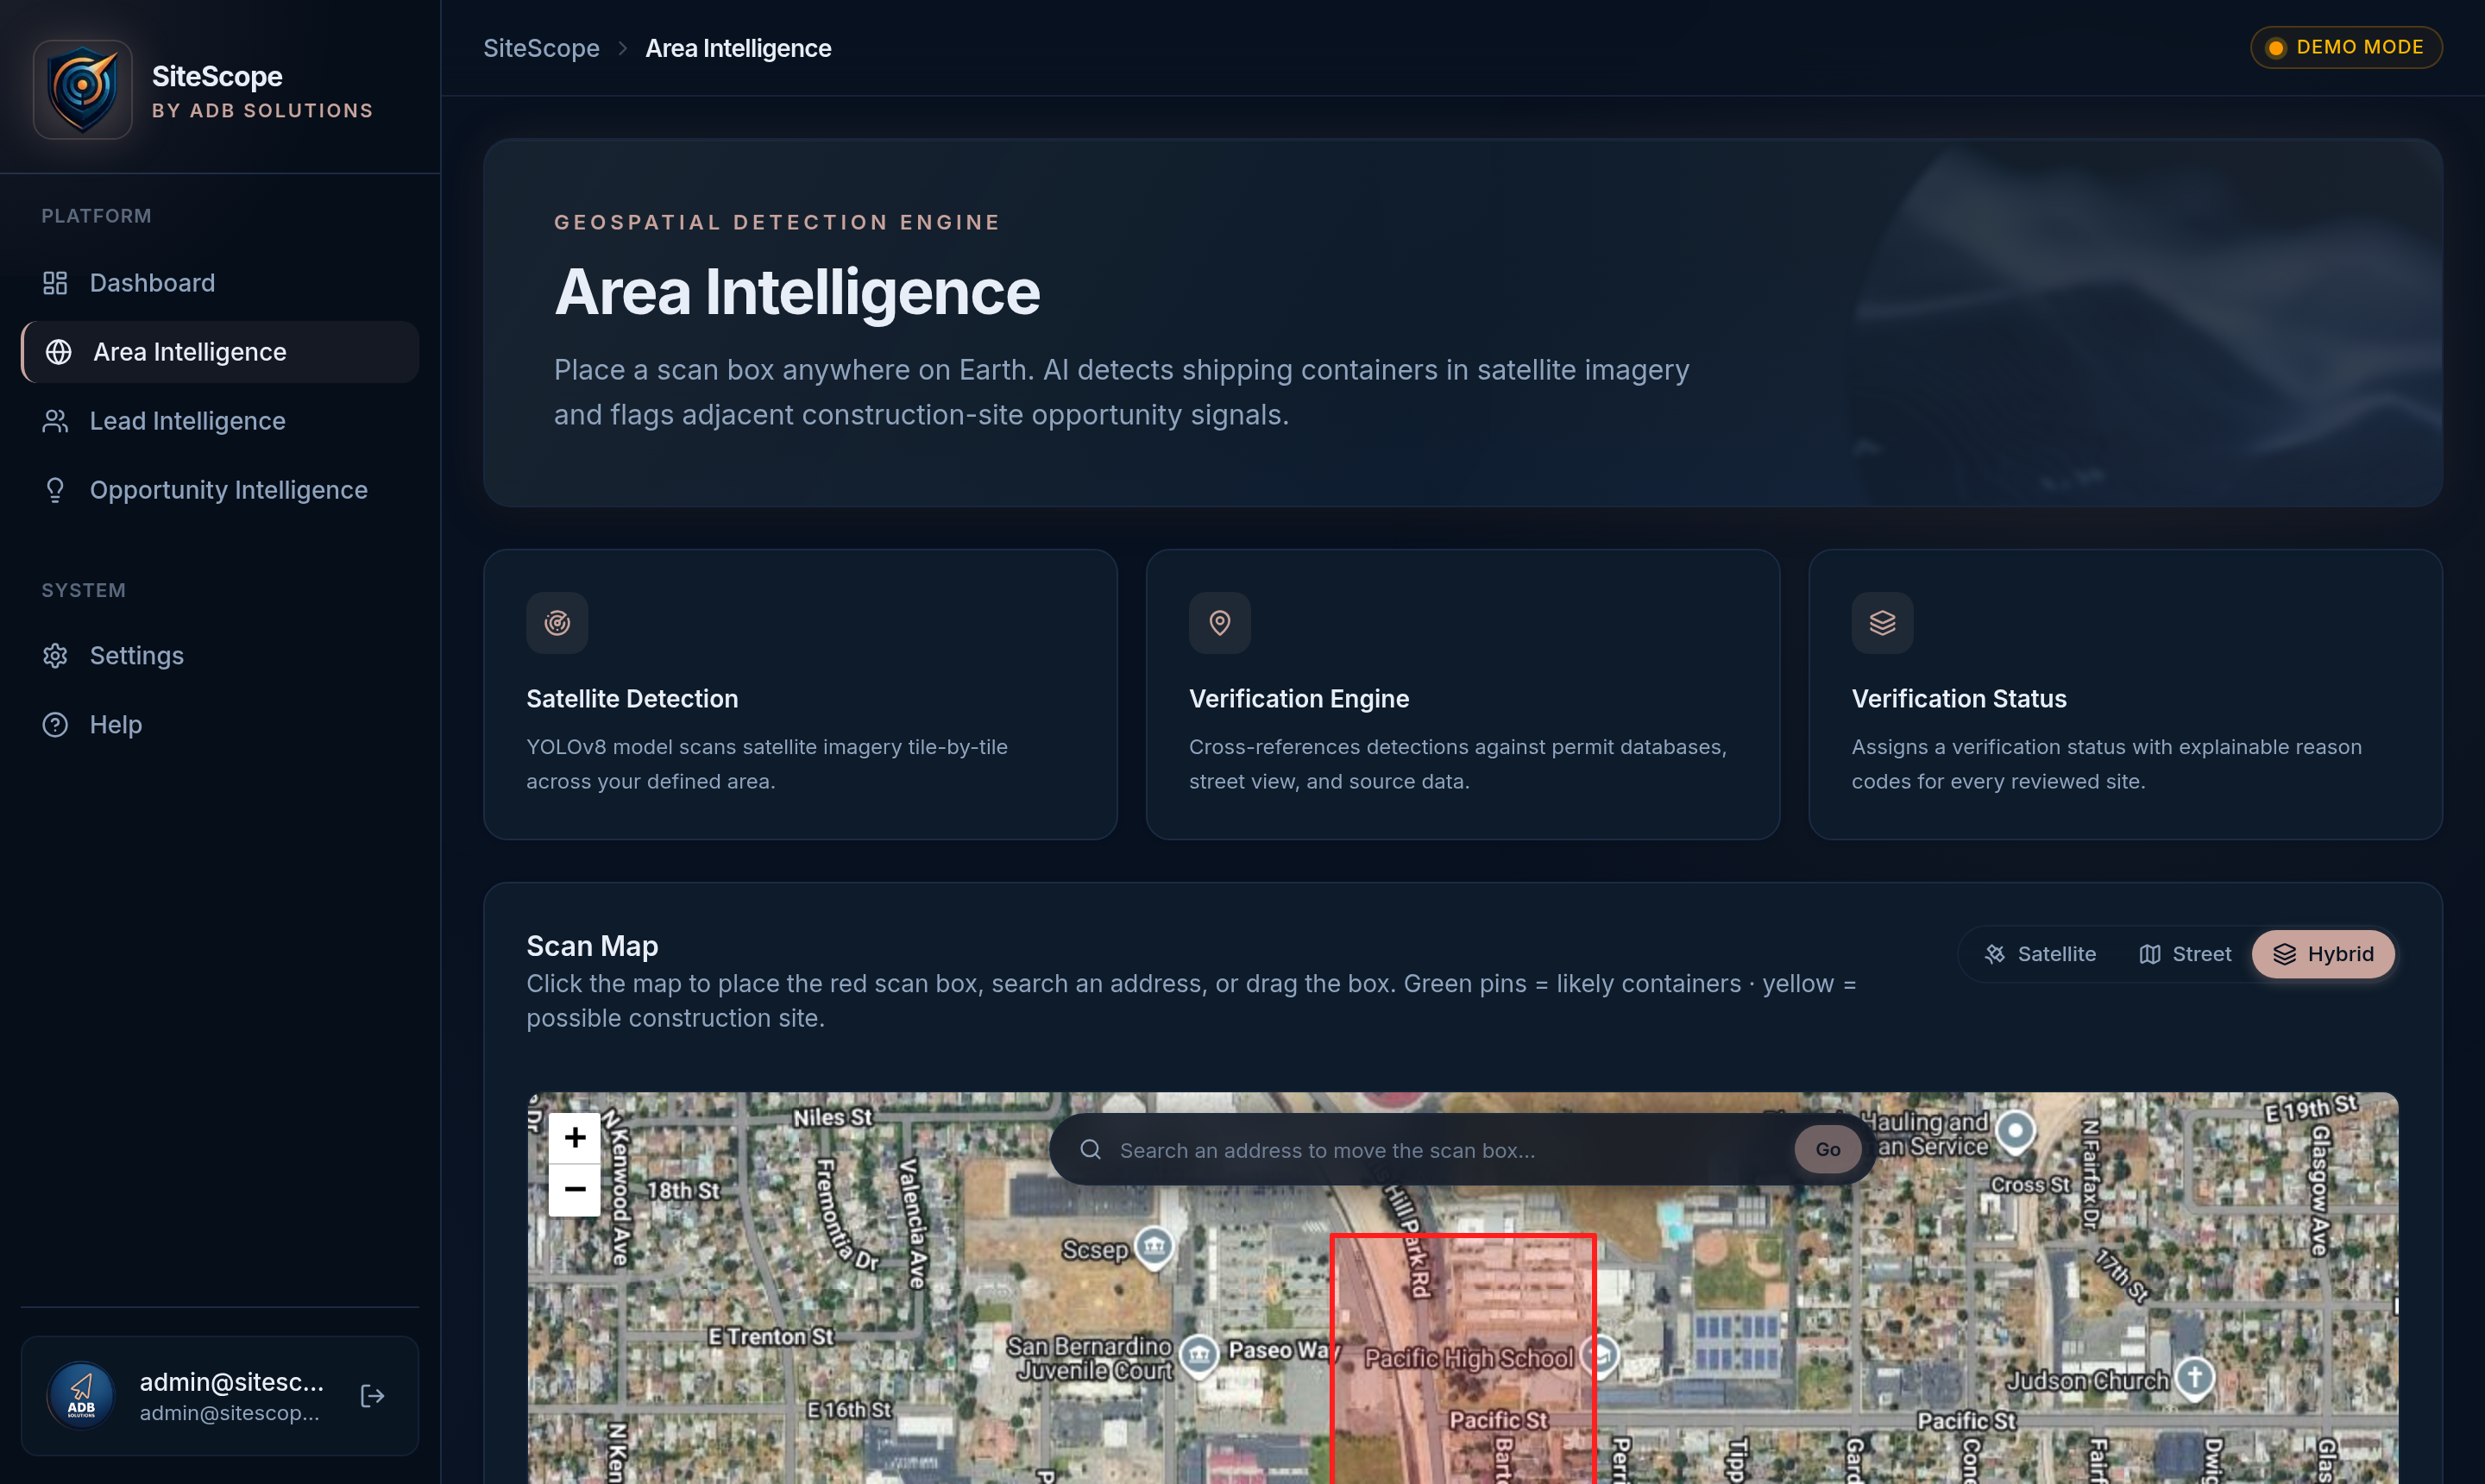
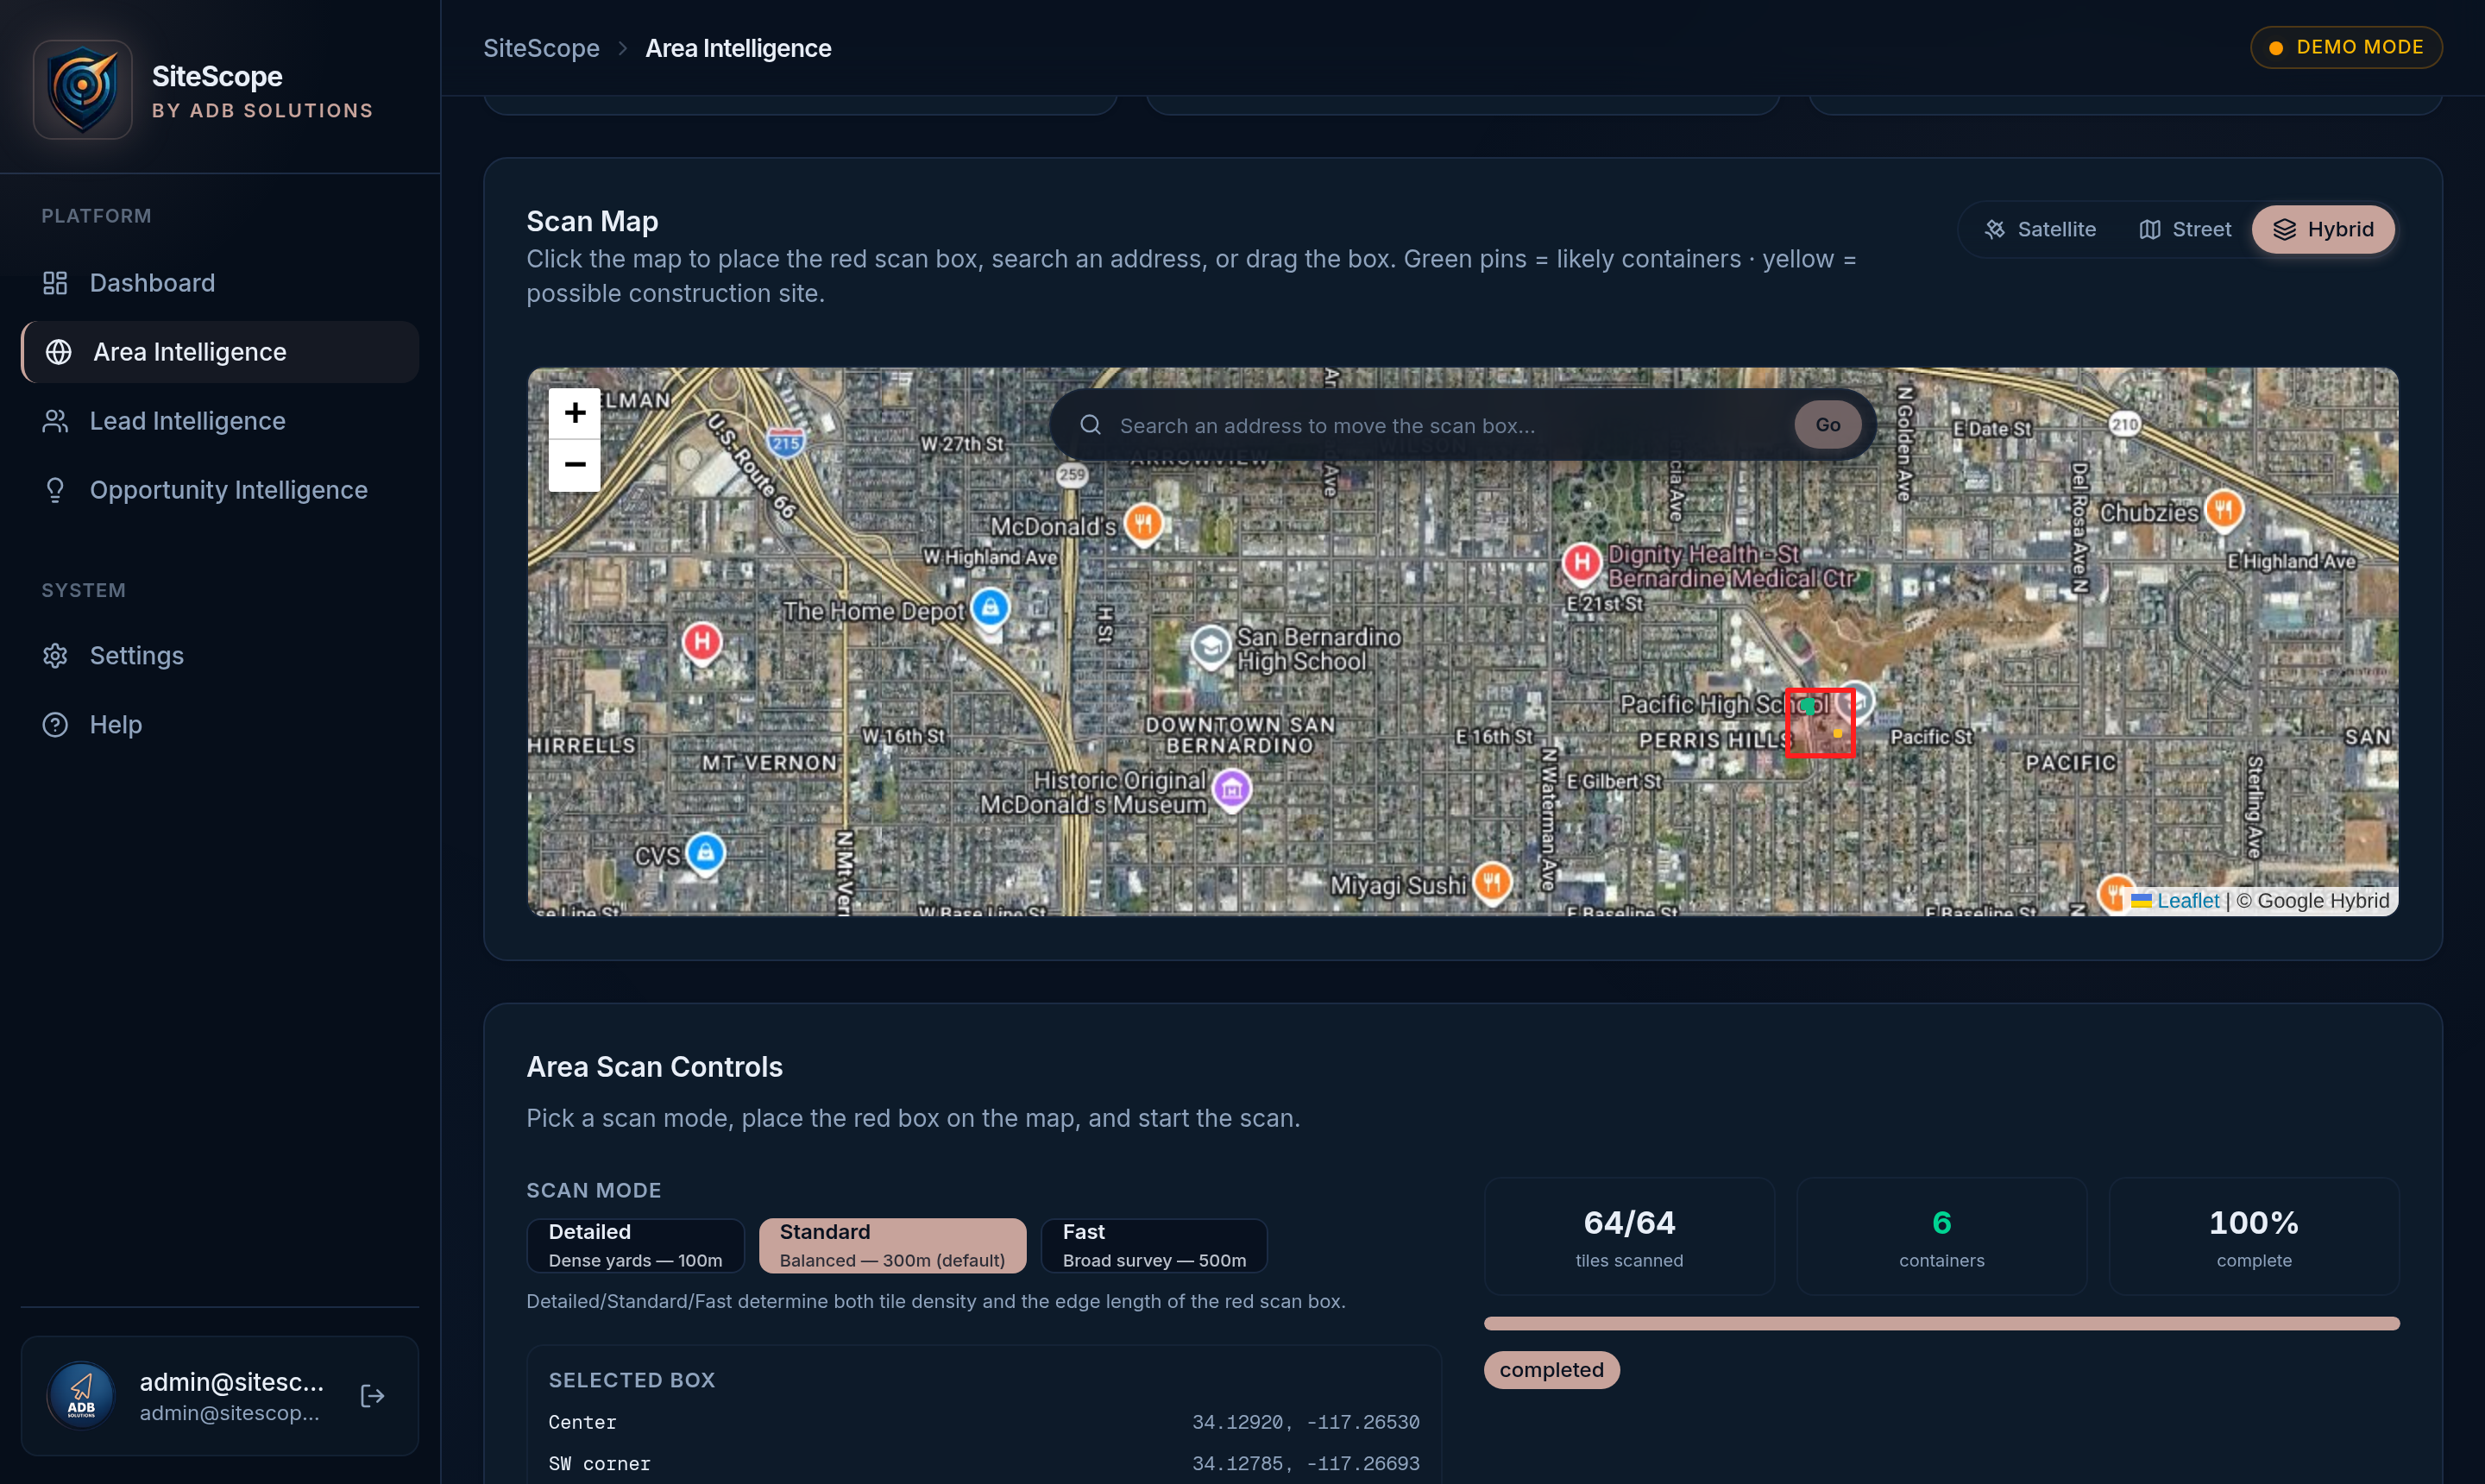
AI-assisted map scanning with human review.Area Intelligence flags possible activity signals for review — possible indicators, not verified detections.